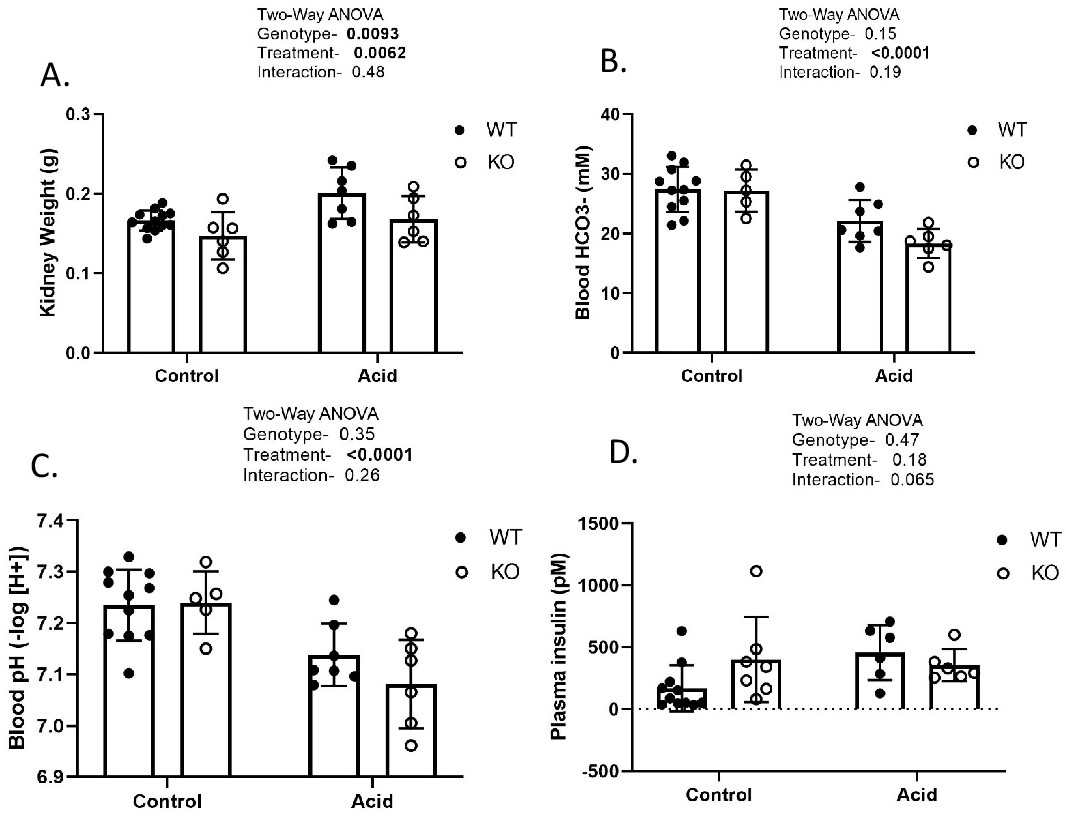
Fig. 3. Kidney weight and blood chemistry. A. final kidney weight; B. blood bicarbonate; C. blood pH; and D. plasma insulin (mean ± standard deviation) after one-week of either control or acid-loading conditions; significant differences due to genotype, treatment or their interactions, as determined by two-way ANOVA. P-values shown in the inset with significant values (p<0.05) bolded.